
- Start >
- Groundwater >
- Waterlevel of deep layer >
- Isar >
- Achering T 9f >
- Chart of total period

Chart of total period Achering T 9f
Groundwater levels of the total period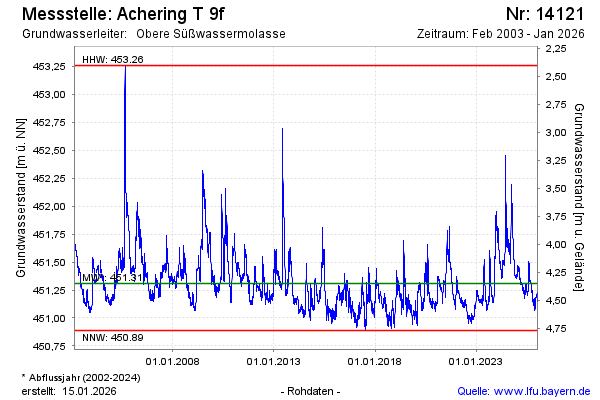
Groundwater level [m above sealevel]: 451.34
Distance to surface [m]: 4.32
Last value from 28.02.2025 09:00
Ground level [m above sealevel]: 455.66
| Date | Groundwater level [m above sealevel] |
|---|---|
| 28.02.2025 | 451.34 |
| 27.02.2025 | 451.35 |
| 26.02.2025 | 451.35 |
| 25.02.2025 | 451.37 |
| 24.02.2025 | 451.36 |
| 23.02.2025 | 451.35 |
| 22.02.2025 | 451.36 |
| 21.02.2025 | 451.35 |
© Bayerisches Landesamt für Umwelt 2025