
- Start >
- Groundwater >
- Waterlevel of deep layer >
- Isar >
- GROSSKOELLNBACH T8 >
- Chart of total period

Chart of total period GROSSKOELLNBACH T8
Groundwater levels of the total period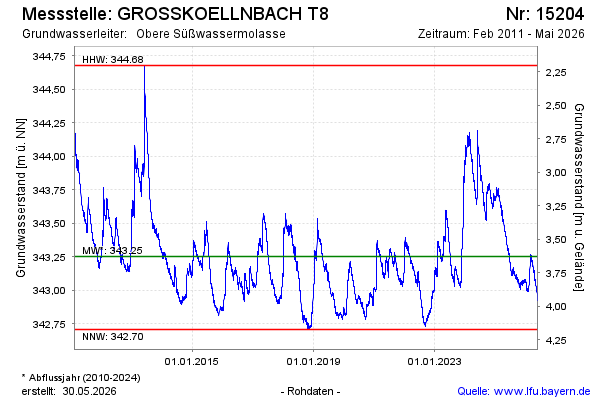
Groundwater level [m above sealevel]: 343.68
Distance to surface [m]: 3.20
Last value from 18.02.2025 10:00
Ground level [m above sealevel]: 346.88
| Date | Groundwater level [m above sealevel] |
|---|---|
| 18.02.2025 | 343.69 |
| 17.02.2025 | 343.70 |
| 16.02.2025 | 343.70 |
| 15.02.2025 | 343.70 |
| 14.02.2025 | 343.69 |
| 13.02.2025 | 343.70 |
| 12.02.2025 | 343.70 |
| 11.02.2025 | 343.70 |
© Bayerisches Landesamt für Umwelt 2025