
- Start >
- Groundwater >
- Waterlevel of deep layer >
- Isar >
- MOOSTHANN T6 >
- Chart of total period

Chart of total period MOOSTHANN T6
Groundwater levels of the total period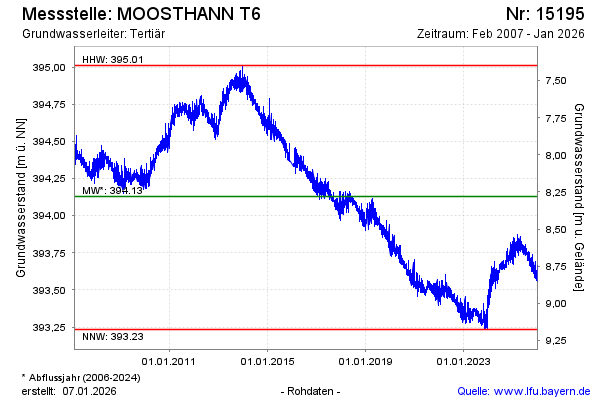
Groundwater level [m above sealevel]: 393.79
Distance to surface [m]: 8.62
Last value from 28.02.2025 10:00
Ground level [m above sealevel]: 402.41
| Date | Groundwater level [m above sealevel] |
|---|---|
| 28.02.2025 | 393.80 |
| 27.02.2025 | 393.81 |
| 26.02.2025 | 393.82 |
| 25.02.2025 | 393.83 |
| 24.02.2025 | 393.78 |
| 23.02.2025 | 393.77 |
| 22.02.2025 | 393.80 |
| 21.02.2025 | 393.78 |
© Bayerisches Landesamt für Umwelt 2025