
- Start >
- Groundwater >
- Waterlevel of deep layer >
- Isar >
- NIEDERROTH T 7t >
- Chart of total period

Chart of total period NIEDERROTH T 7t
Groundwater levels of the total period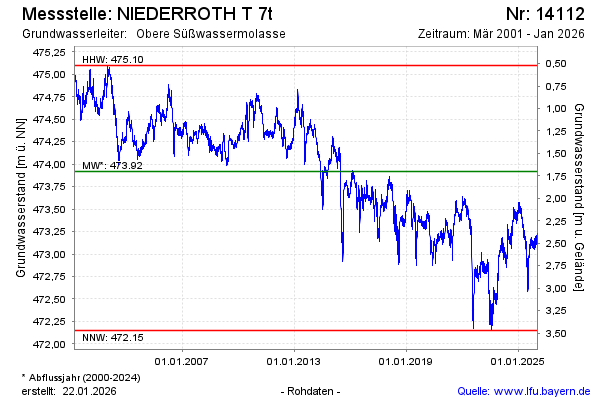
Groundwater level [m above sealevel]: 473.43
Distance to surface [m]: 2.19
Last value from 13.03.2025 09:00
Ground level [m above sealevel]: 475.62
| Date | Groundwater level [m above sealevel] |
|---|---|
| 13.03.2025 | 473.43 |
| 12.03.2025 | 473.44 |
| 11.03.2025 | 473.44 |
| 10.03.2025 | 473.41 |
| 09.03.2025 | 473.42 |
| 08.03.2025 | 473.43 |
| 07.03.2025 | 473.40 |
| 06.03.2025 | 473.42 |
© Bayerisches Landesamt für Umwelt 2025