
- Start >
- Groundwater >
- Waterlevel of deep layer >
- Obere Donau >
- GUNDREMMINGEN TB >
- Chart of total period

Chart of total period GUNDREMMINGEN TB
Groundwater levels of the total period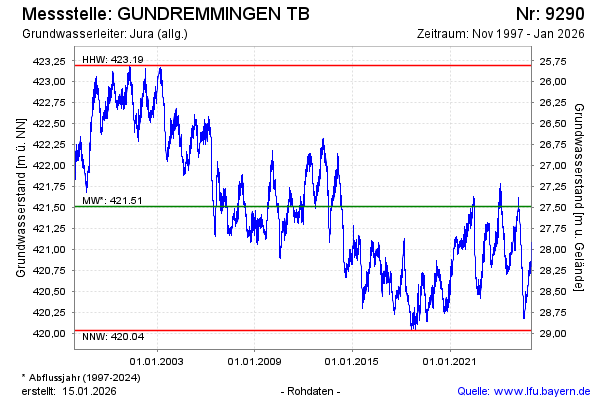
Groundwater level [m above sealevel]: 421.60
Distance to surface [m]: 27.40
Last value from 14.03.2025 06:00
Ground level [m above sealevel]: 449.00
| Date | Groundwater level [m above sealevel] |
|---|---|
| 13.03.2025 | 421.62 |
| 12.03.2025 | 421.61 |
| 11.03.2025 | 421.57 |
| 10.03.2025 | 421.57 |
| 09.03.2025 | 421.54 |
| 08.03.2025 | 421.49 |
| 07.03.2025 | 421.45 |
| 06.03.2025 | 421.43 |
© Bayerisches Landesamt für Umwelt 2025