
- Start >
- Groundwater >
- Waterlevel of deep layer >
- Obere Donau >
- LICHTENAU B1 >
- Chart of total period

Chart of total period LICHTENAU B1
Groundwater levels of the total period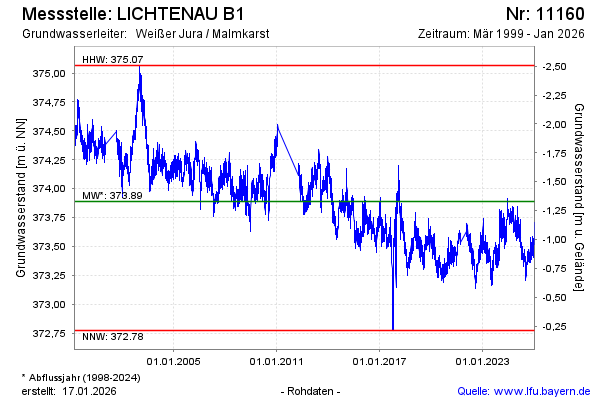
Groundwater level [m above sealevel]: 373.74
Distance to surface [m]: -1.18
Last value from 27.07.2024 06:00
Ground level [m above sealevel]: 372.56
| Date | Groundwater level [m above sealevel] |
|---|---|
| 26.07.2024 | 373.74 |
| 25.07.2024 | 373.73 |
| 24.07.2024 | 373.72 |
| 23.07.2024 | 373.72 |
| 22.07.2024 | 373.74 |
| 21.07.2024 | 373.77 |
| 20.07.2024 | 373.76 |
| 19.07.2024 | 373.73 |
© Bayerisches Landesamt für Umwelt 2024