
- Start >
- Groundwater >
- Waterlevel of deep layer >
- Naab - Regen >
- Mappach >
- Chart of total period

Chart of total period Mappach
Groundwater levels of the total period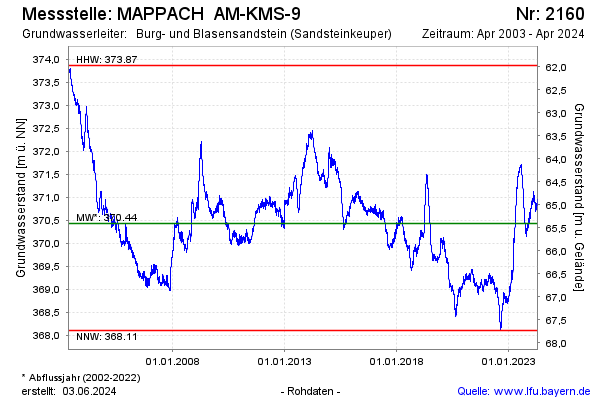
Groundwater level [m above sealevel]: 370.92
Distance to surface [m]: 64.92
Last value from 05.03.2025 11:00
Ground level [m above sealevel]: 435.84
| Date | Groundwater level [m above sealevel] |
|---|---|
| 05.03.2025 | 370.91 |
| 04.03.2025 | 370.88 |
| 03.03.2025 | 370.84 |
| 02.03.2025 | 370.80 |
| 01.03.2025 | 370.81 |
| 28.02.2025 | 370.84 |
| 27.02.2025 | 370.87 |
| 26.02.2025 | 370.89 |
© Bayerisches Landesamt für Umwelt 2025