
- Start >
- Groundwater >
- Waterlevel of deep layer >
- Untere Donau >
- Geiselhöring T3 >
- Chart of total period

Chart of total period Geiselhöring T3
Groundwater levels of the total period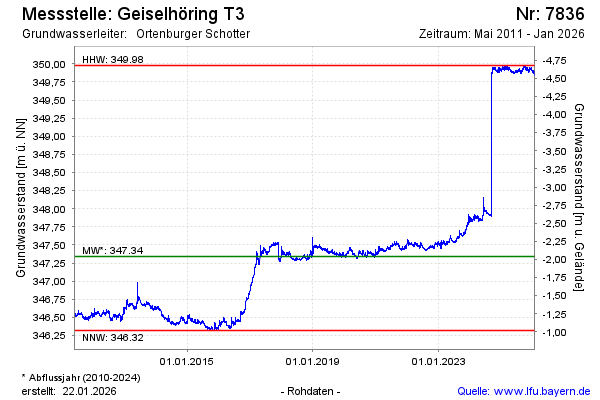
note
GW Messstelle im Grundnetz
Groundwater level [m above sealevel]: 349.97
Distance to surface [m]: -4.67
Last value from 13.03.2025 08:00
Ground level [m above sealevel]: 345.30
| Date | Groundwater level [m above sealevel] |
|---|---|
| 13.03.2025 | 349.96 |
| 12.03.2025 | 349.96 |
| 11.03.2025 | 349.96 |
| 10.03.2025 | 349.96 |
| 09.03.2025 | 349.95 |
| 08.03.2025 | 349.94 |
| 07.03.2025 | 349.93 |
| 06.03.2025 | 349.93 |
© Bayerisches Landesamt für Umwelt 2025