
- Start >
- Groundwater >
- Waterlevel of deep layer >
- Regnitz >
- PETERSGMUEND TB 209 >
- Chart of total period

Chart of total period PETERSGMUEND TB 209
Groundwater levels of the total period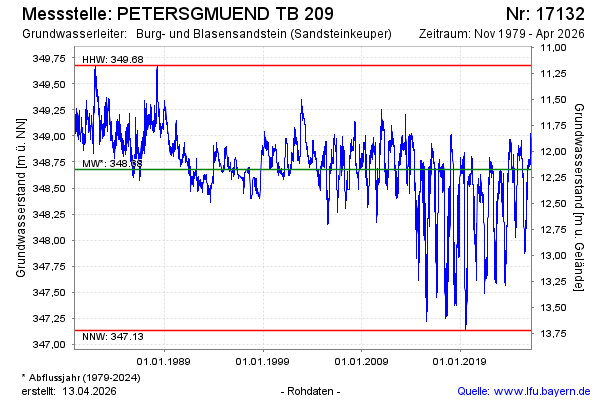
note
Hinweis: auf Grund von technischen Problemen werden die Messdaten derzeit nicht aktualisiert
Groundwater level [m above sealevel]: 348.85
Distance to surface [m]: 12.00
Last value from 21.02.2025 10:00
Ground level [m above sealevel]: 360.85
| Date | Groundwater level [m above sealevel] |
|---|---|
| 24.02.2025 | 348.84 |
| 23.02.2025 | 348.83 |
| 22.02.2025 | 348.85 |
| 21.02.2025 | 348.85 |
| 20.02.2025 | 348.86 |
| 19.02.2025 | 348.87 |
| 18.02.2025 | 348.87 |
| 17.02.2025 | 348.88 |
© Bayerisches Landesamt für Umwelt 2025