
- Start >
- Groundwater >
- Flow of springs >
- Bayern >
- Hacklau Qu. rechts+links >
- Chart of total period

Chart of total period Hacklau Qu. rechts+links
Flow of wells of the total period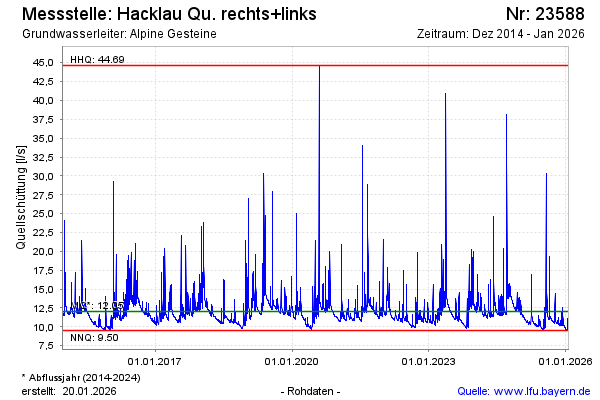
Flow [l/s]: 12,35
Last value from 21.11.2024 09:00
Ground level [m above sealevel]: --
| Date | Flow of well [l/s] |
|---|---|
| 21.11.2024 | 12.35 |
| 20.11.2024 | 12.40 |
| 19.11.2024 | 12.39 |
| 18.11.2024 | 12.41 |
| 17.11.2024 | 12.44 |
| 16.11.2024 | 12.48 |
| 15.11.2024 | 12.53 |
| 14.11.2024 | 12.59 |
© Bayerisches Landesamt für Umwelt 2024