
- Start >
- Groundwater >
- Flow of springs >
- Bayern >
- Hetzlesquellen 1-5 >
- Chart of total period

Chart of total period Hetzlesquellen 1-5
Flow of wells of the total period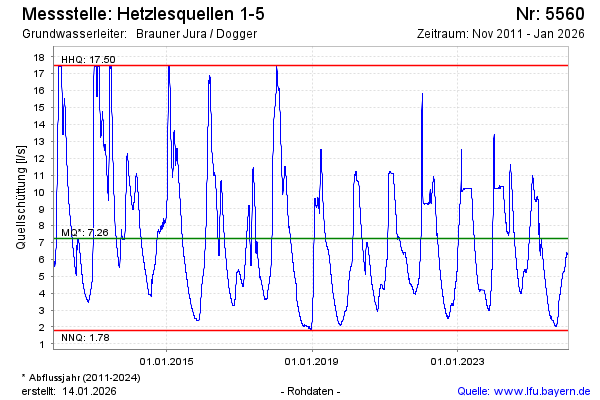
note
Gesamt-Schüttung wird ab 11 l/s gedrosselt.
Flow [l/s]: 9,50
Last value from 15.02.2025 10:00
Ground level [m above sealevel]: 400.00
| Date | Flow of well [l/s] |
|---|---|
| 15.02.2025 | 9.54 |
| 14.02.2025 | 9.55 |
| 13.02.2025 | 9.61 |
| 12.02.2025 | 9.63 |
| 11.02.2025 | 9.70 |
| 10.02.2025 | 9.79 |
| 09.02.2025 | 9.87 |
| 08.02.2025 | 9.95 |
© Bayerisches Landesamt für Umwelt 2025