
- Start >
- Groundwater >
- Flow of springs >
- Bayern >
- Kalkofenquelle >
- Chart of total period

Chart of total period Kalkofenquelle
Flow of wells of the total period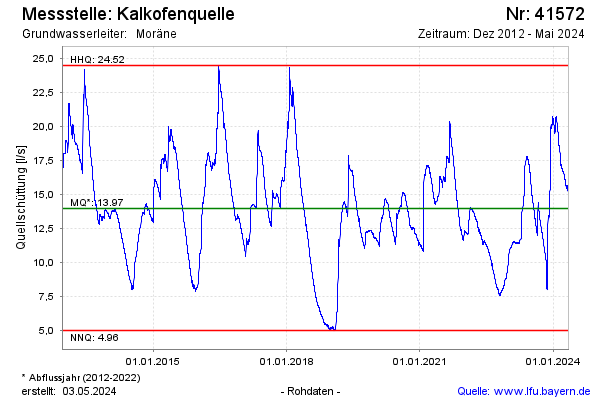
Flow [l/s]: 13,61
Last value from 13.03.2025 10:00
Ground level [m above sealevel]: 770.00
| Date | Flow of well [l/s] |
|---|---|
| 13.03.2025 | 13.56 |
| 12.03.2025 | 13.59 |
| 11.03.2025 | 13.61 |
| 10.03.2025 | 13.67 |
| 09.03.2025 | 13.72 |
| 08.03.2025 | 13.78 |
| 07.03.2025 | 13.85 |
| 06.03.2025 | 13.91 |
© Bayerisches Landesamt für Umwelt 2025