
- Start >
- Groundwater >
- Flow of springs >
- Bayern >
- Karstquelle Obereichstätt >
- Chart of total period

Chart of total period Karstquelle Obereichstätt
Flow of wells of the total period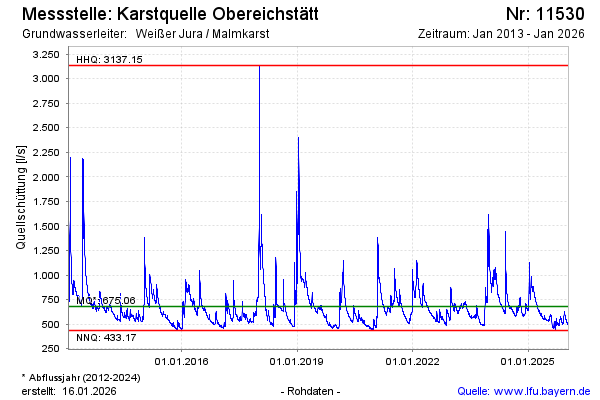
Flow [l/s]: 577,86
Last value from 19.11.2024 09:00
Ground level [m above sealevel]: --
| Date | Flow of well [l/s] |
|---|---|
| 19.11.2024 | 582.42 |
| 18.11.2024 | 581.30 |
| 17.11.2024 | 583.24 |
| 16.11.2024 | 582.28 |
| 15.11.2024 | 579.33 |
| 14.11.2024 | 584.72 |
| 13.11.2024 | 586.16 |
| 12.11.2024 | 591.31 |
© Bayerisches Landesamt für Umwelt 2024