
- Start >
- Groundwater >
- Flow of springs >
- Bayern >
- Kupfgrabenquelle I + III >
- Chart of total period

Chart of total period Kupfgrabenquelle I + III
Flow of wells of the total period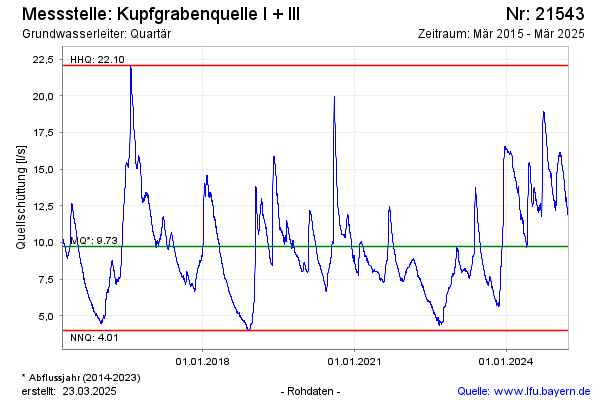
Flow [l/s]: 12,48
Last value from 14.03.2025 10:00
Ground level [m above sealevel]: 495.00
| Date | Flow of well [l/s] |
|---|---|
| 14.03.2025 | 12.42 |
| 13.03.2025 | 12.48 |
| 12.03.2025 | 12.53 |
| 11.03.2025 | 12.68 |
| 10.03.2025 | 12.93 |
| 09.03.2025 | 13.10 |
| 08.03.2025 | 12.93 |
| 07.03.2025 | 12.90 |
© Bayerisches Landesamt für Umwelt 2025