
- Start >
- Groundwater >
- Flow of springs >
- Bayern >
- Mühlbachquelle 1-3 >
- Chart of total period

Chart of total period Mühlbachquelle 1-3
Flow of wells of the total period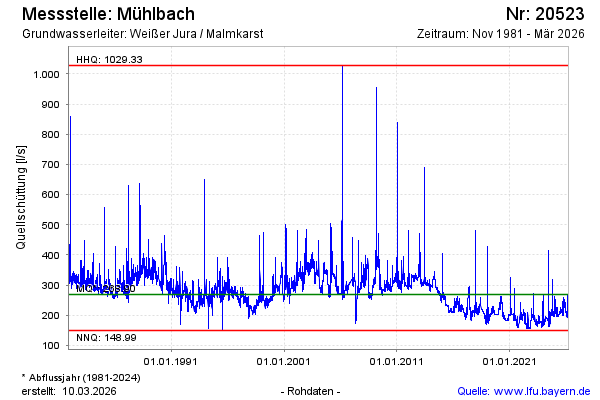
Flow [l/s]: 224,49
Last value from 13.03.2025 07:30
Ground level [m above sealevel]: 365.73
| Date | Flow of well [l/s] |
|---|---|
| 12.03.2025 | 220.08 |
| 11.03.2025 | 219.87 |
| 10.03.2025 | 219.24 |
| 09.03.2025 | 217.88 |
| 08.03.2025 | 214.09 |
| 07.03.2025 | 213.88 |
| 06.03.2025 | 212.61 |
| 05.03.2025 | 212.40 |
© Bayerisches Landesamt für Umwelt 2025