
- Start >
- Groundwater >
- Flow of springs >
- Bayern >
- Pleckenstein I-IV >
- Chart of total period

Chart of total period Pleckenstein I-IV
Flow of wells of the total period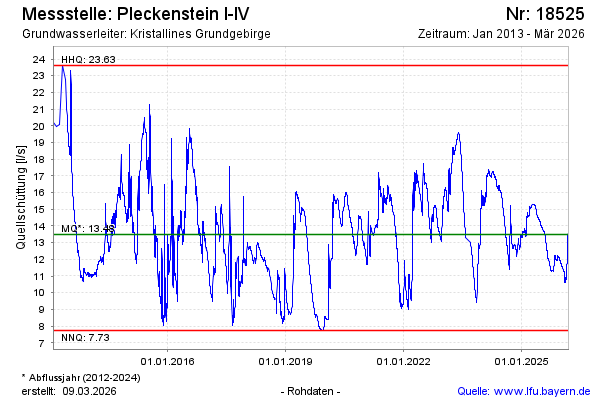
Flow [l/s]: 13,56
Last value from 26.12.2024 01:00
Ground level [m above sealevel]: --
| Date | Flow of well [l/s] |
|---|---|
| 25.12.2024 | 13.42 |
| 24.12.2024 | 13.40 |
| 23.12.2024 | 13.21 |
| 22.12.2024 | 13.18 |
| 21.12.2024 | 13.11 |
| 20.12.2024 | 13.03 |
| 19.12.2024 | 12.89 |
| 18.12.2024 | 12.81 |
© Bayerisches Landesamt für Umwelt 2024