
- Start >
- Groundwater >
- Flow of springs >
- Bayern >
- Rassreuth Quelle I >
- Chart of total period

Chart of total period Rassreuth Quelle I
Flow of wells of the total period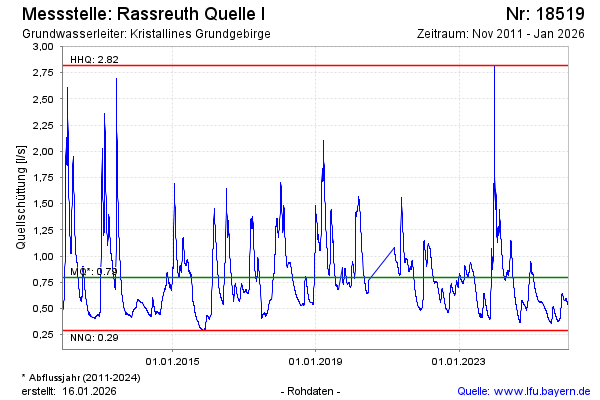
Flow [l/s]: 0,82
Last value from 13.01.2025 00:00
Ground level [m above sealevel]: 625.00
| Date | Flow of well [l/s] |
|---|---|
| 11.01.2025 | 0.84 |
| 10.01.2025 | 0.84 |
| 09.01.2025 | 0.85 |
| 08.01.2025 | 0.85 |
| 07.01.2025 | 0.86 |
| 06.01.2025 | 0.88 |
| 05.01.2025 | 0.89 |
| 04.01.2025 | 0.90 |
© Bayerisches Landesamt für Umwelt 2025