
- Start >
- Groundwater >
- Flow of springs >
- Bayern >
- Strailach Quellen 3-5 >
- Chart of total period

Chart of total period Strailach Quellen 3-5
Flow of wells of the total period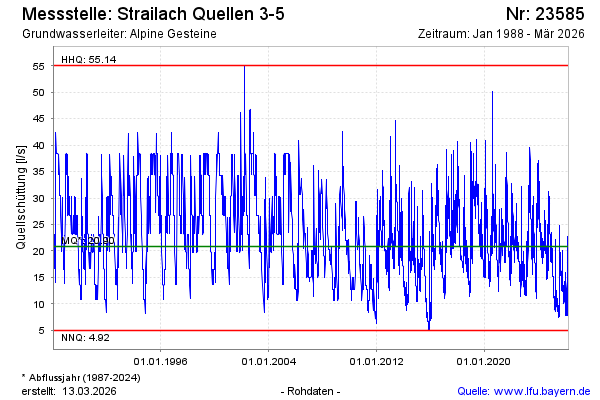
Flow [l/s]: 19,69
Last value from 22.12.2024 07:00
Ground level [m above sealevel]: 450.00
| Date | Flow of well [l/s] |
|---|---|
| 21.12.2024 | 20.20 |
| 20.12.2024 | 19.81 |
| 19.12.2024 | 18.75 |
| 18.12.2024 | 19.10 |
| 17.12.2024 | 18.89 |
| 16.12.2024 | 17.85 |
| 15.12.2024 | 18.07 |
| 14.12.2024 | 18.67 |
© Bayerisches Landesamt für Umwelt 2024