
- Start >
- Groundwater >
- Flow of springs >
- Bayern >
- Unterammergau Q Speicherzulauf >
- Chart of total period

Chart of total period Unterammergau Q Speicherzulauf
Flow of wells of the total period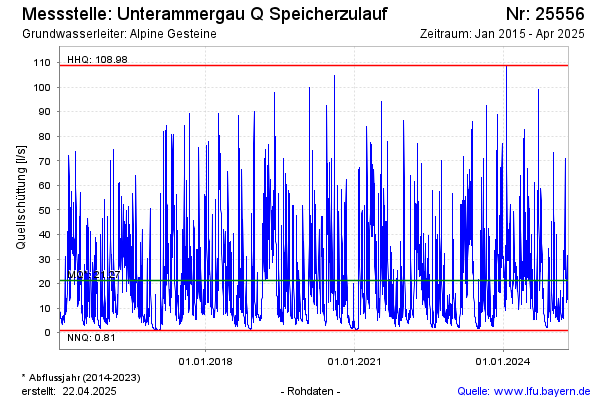
Flow [l/s]: 10,60
Last value from 26.12.2024 04:00
Ground level [m above sealevel]: 1.150.00
| Date | Flow of well [l/s] |
|---|---|
| 25.12.2024 | 12.28 |
| 24.12.2024 | 16.36 |
| 23.12.2024 | 31.79 |
| 22.12.2024 | 45.47 |
| 21.12.2024 | 15.15 |
| 20.12.2024 | 28.77 |
| 19.12.2024 | 28.60 |
| 18.12.2024 | 18.88 |
© Bayerisches Landesamt für Umwelt 2024