
- Start >
- Groundwater >
- Flow of springs >
- Bayern >
- Unterwaiz >
- Chart of total period

Chart of total period Unterwaiz
Flow of wells of the total period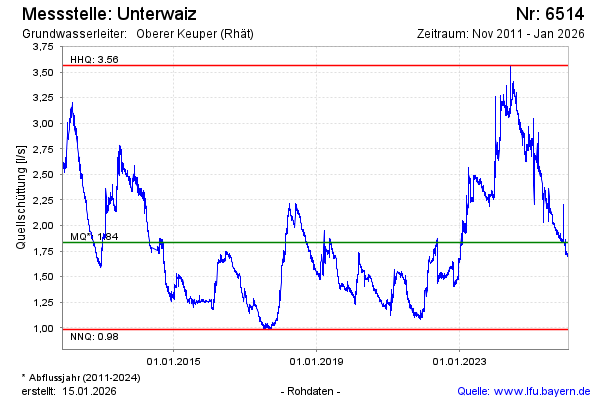
Flow [l/s]: 3,29
Last value from 17.07.2024 10:00
Ground level [m above sealevel]: --
| Date | Flow of well [l/s] |
|---|---|
| 17.07.2024 | 3.32 |
| 16.07.2024 | 3.29 |
| 15.07.2024 | 3.28 |
| 14.07.2024 | 3.31 |
| 13.07.2024 | 3.33 |
| 12.07.2024 | 3.32 |
| 11.07.2024 | 3.30 |
| 10.07.2024 | 3.31 |
© Bayerisches Landesamt für Umwelt 2024