
- Start >
- Groundwater >
- Flow of springs >
- Bayern >
- Waldbrunnen 2/3 >
- Chart of total period

Chart of total period Waldbrunnen 2/3
Flow of wells of the total period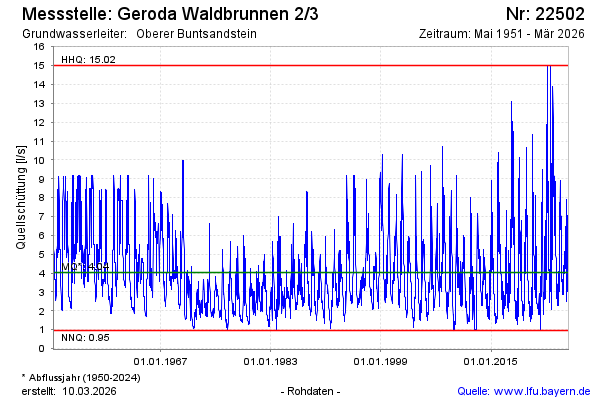
Flow [l/s]: 6,34
Last value from 17.02.2025 10:00
Ground level [m above sealevel]: 560.00
| Date | Flow of well [l/s] |
|---|---|
| 17.02.2025 | 6.52 |
| 16.02.2025 | 6.73 |
| 15.02.2025 | 6.82 |
| 14.02.2025 | 6.85 |
| 13.02.2025 | 7.01 |
| 12.02.2025 | 6.94 |
| 11.02.2025 | 6.60 |
| 10.02.2025 | 6.64 |
© Bayerisches Landesamt für Umwelt 2025