
- Start >
- Groundwater >
- Flow of springs >
- Bayern >
- Weiding Quelle I >
- Chart of total period

Chart of total period Weiding Quelle I
Flow of wells of the total period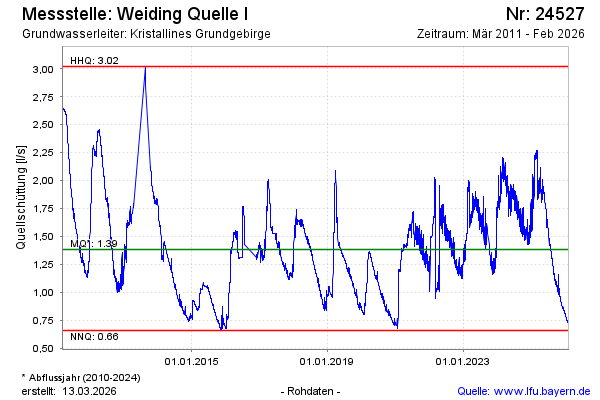
Flow [l/s]: 1,60
Last value from 26.12.2024 09:00
Ground level [m above sealevel]: 720.00
| Date | Flow of well [l/s] |
|---|---|
| 26.12.2024 | 1.59 |
| 25.12.2024 | 1.55 |
| 24.12.2024 | 1.49 |
| 23.12.2024 | 1.54 |
| 22.12.2024 | 1.51 |
| 21.12.2024 | 1.54 |
| 20.12.2024 | 1.54 |
| 19.12.2024 | 1.57 |
© Bayerisches Landesamt für Umwelt 2024