
- Start >
- Groundwater >
- Flow of springs >
- Bayern >
- Wiesengrundquellen >
- Chart of total period

Chart of total period Wiesengrundquellen
Flow of wells of the total period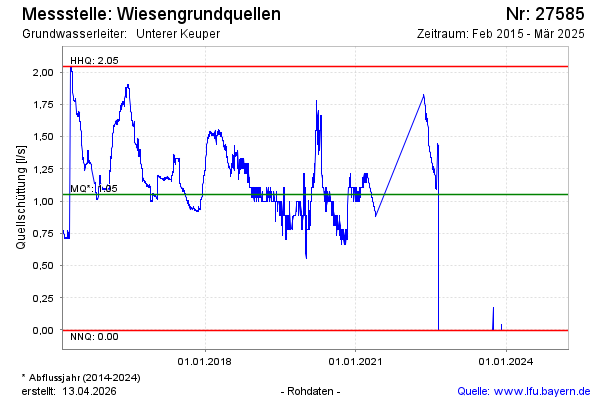
note
Messwerte sind seit 28.08.2022 nicht korrekt
Flow [l/s]: 0,00
Last value from 14.03.2025 09:00
Ground level [m above sealevel]: 235.00
| Date | Flow of well [l/s] |
|---|---|
| 14.03.2025 | 0.00 |
| 13.03.2025 | 0.00 |
| 12.03.2025 | 0.00 |
| 11.03.2025 | 0.00 |
| 10.03.2025 | 0.00 |
| 09.03.2025 | 0.00 |
| 08.03.2025 | 0.00 |
| 07.03.2025 | 0.00 |
© Bayerisches Landesamt für Umwelt 2025