
- Start >
- Groundwater >
- Flow of springs >
- Oberer Main - Elbe >
- Aschenbrunnen Pottenstein >
- Chart of total period

Chart of total period Aschenbrunnen Pottenstein
Flow of wells of the total period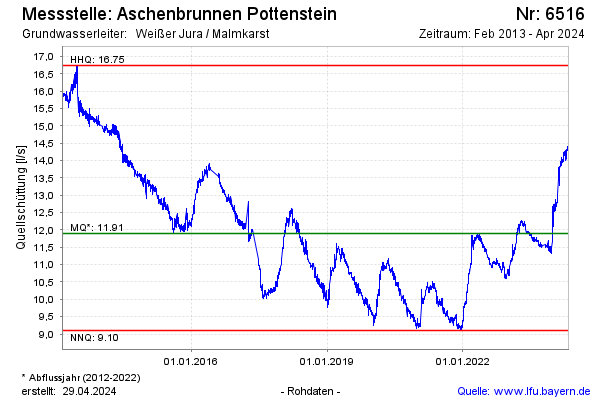
Flow [l/s]: 51,30
Last value from 13.01.2025 07:45
Ground level [m above sealevel]: --
| Date | Flow of well [l/s] |
|---|---|
| 13.01.2025 | 38.60 |
| 12.01.2025 | 38.74 |
| 11.01.2025 | 37.26 |
| 10.01.2025 | 39.18 |
| 09.01.2025 | 39.19 |
| 08.01.2025 | 41.55 |
| 07.01.2025 | 42.26 |
| 06.01.2025 | 46.40 |
© Bayerisches Landesamt für Umwelt 2025