
- Start >
- Groundwater >
- Flow of springs >
- Oberer Main - Elbe >
- Bischofsried >
- Chart of total period

Chart of total period Bischofsried
Flow of wells of the total period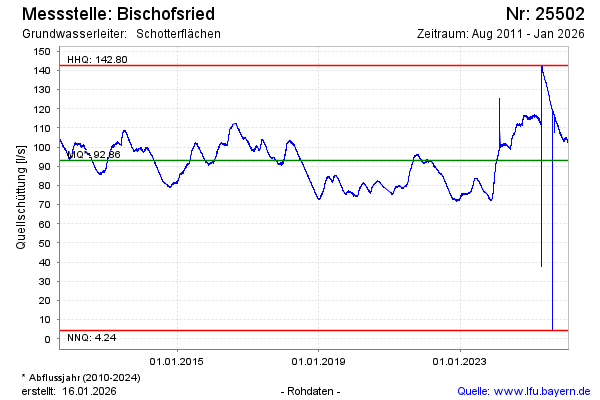
Flow [l/s]: 113,36
Last value from 04.12.2024 07:45
Ground level [m above sealevel]: --
| Date | Flow of well [l/s] |
|---|---|
| 03.12.2024 | 114.72 |
| 02.12.2024 | 115.07 |
| 01.12.2024 | 114.94 |
| 30.11.2024 | 114.71 |
| 29.11.2024 | 114.40 |
| 28.11.2024 | 114.39 |
| 27.11.2024 | 114.75 |
| 26.11.2024 | 114.42 |
© Bayerisches Landesamt für Umwelt 2024