
- Start >
- Groundwater >
- Flow of springs >
- Inn >
- Hitzler/Marienberg 1 >
- Chart of total period

Chart of total period Hitzler/Marienberg 1
Flow of wells of the total period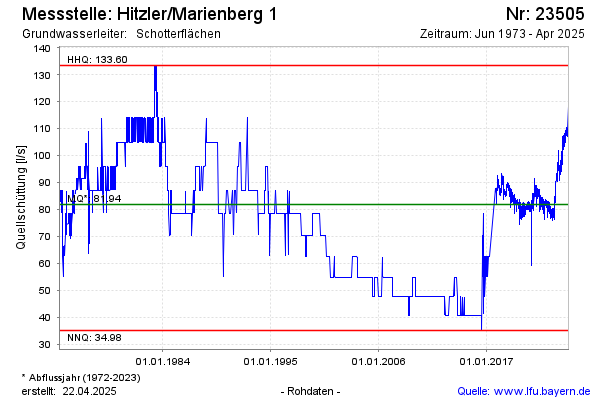
Flow [l/s]: 109,08
Last value from 09.01.2025 09:00
Ground level [m above sealevel]: 391.31
| Date | Flow of well [l/s] |
|---|---|
| 09.01.2025 | 107.10 |
| 08.01.2025 | 107.65 |
| 07.01.2025 | 107.01 |
| 06.01.2025 | 107.30 |
| 05.01.2025 | 108.98 |
| 04.01.2025 | 108.92 |
| 03.01.2025 | 107.54 |
| 02.01.2025 | 108.14 |
© Bayerisches Landesamt für Umwelt 2025