
- Start >
- Groundwater >
- Flow of springs >
- Inn >
- Schlosswaldquellen >
- Chart of total period

Chart of total period Schlosswaldquellen
Flow of wells of the total period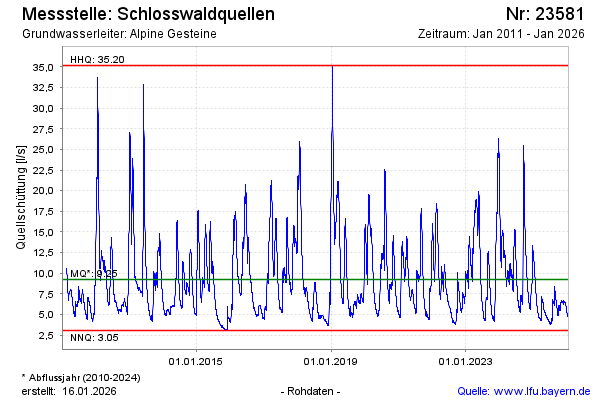
Flow [l/s]: 12,75
Last value from 25.12.2024 07:00
Ground level [m above sealevel]: 545.00
| Date | Flow of well [l/s] |
|---|---|
| 25.12.2024 | 12.72 |
| 24.12.2024 | 12.35 |
| 23.12.2024 | 10.92 |
| 22.12.2024 | 9.69 |
| 21.12.2024 | 8.85 |
| 20.12.2024 | 8.68 |
| 19.12.2024 | 8.36 |
| 18.12.2024 | 8.34 |
© Bayerisches Landesamt für Umwelt 2024