
- Start >
- Groundwater >
- Flow of springs >
- Isar >
- Hitzler/Marienberg 1 >
- Chart of total period

Chart of total period Hitzler/Marienberg 1
Flow of wells of the total period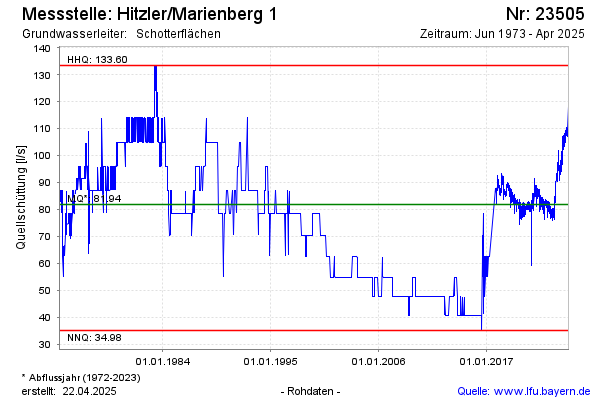
Flow [l/s]: 108,19
Last value from 28.02.2025 09:00
Ground level [m above sealevel]: 391.31
| Date | Flow of well [l/s] |
|---|---|
| 28.02.2025 | 108.94 |
| 27.02.2025 | 109.61 |
| 26.02.2025 | 108.60 |
| 25.02.2025 | 108.84 |
| 24.02.2025 | 110.13 |
| 23.02.2025 | 109.82 |
| 22.02.2025 | 109.61 |
| 21.02.2025 | 109.63 |
© Bayerisches Landesamt für Umwelt 2025