
- Start >
- Groundwater >
- Flow of springs >
- Isar >
- Unterammergau Q Speicherzulauf >
- Chart of total period

Chart of total period Unterammergau Q Speicherzulauf
Flow of wells of the total period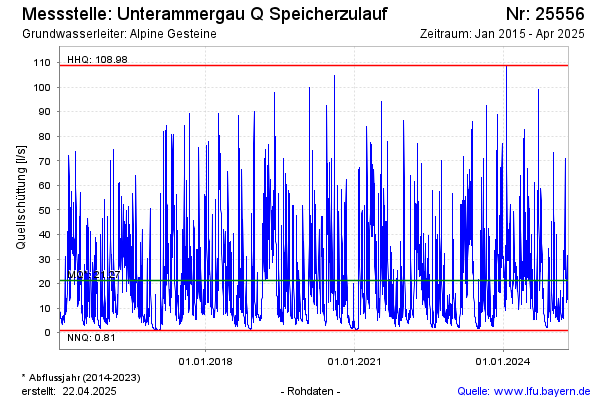
Flow [l/s]: 6,67
Last value from 16.02.2025 04:00
Ground level [m above sealevel]: 1.150.00
| Date | Flow of well [l/s] |
|---|---|
| 15.02.2025 | 7.46 |
| 14.02.2025 | 10.25 |
| 13.02.2025 | 14.00 |
| 12.02.2025 | 8.82 |
| 11.02.2025 | 5.00 |
| 10.02.2025 | 4.50 |
| 09.02.2025 | 4.70 |
| 08.02.2025 | 4.92 |
© Bayerisches Landesamt für Umwelt 2025