
- Start >
- Groundwater >
- Flow of springs >
- Obere Donau >
- VILSQU.,KLEINSCHOENBR. >
- Chart of total period

Chart of total period VILSQU.,KLEINSCHOENBR.
Flow of wells of the total period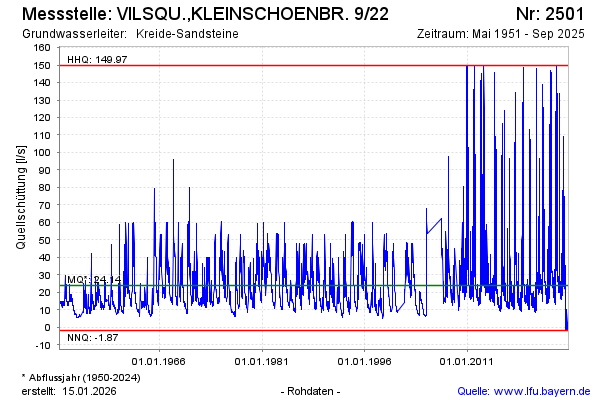
Flow [l/s]: 28,71
Last value from 24.11.2024 09:00
Ground level [m above sealevel]: 455.00
| Date | Flow of well [l/s] |
|---|---|
| 24.11.2024 | 28.23 |
| 23.11.2024 | 28.67 |
| 22.11.2024 | 32.76 |
| 21.11.2024 | 40.79 |
| 20.11.2024 | 58.23 |
| 19.11.2024 | 38.30 |
| 18.11.2024 | 21.50 |
| 17.11.2024 | 19.91 |
© Bayerisches Landesamt für Umwelt 2024