
- Start >
- Groundwater >
- Flow of springs >
- Unterer Main >
- Metzenbachquelle >
- Chart of total period

Chart of total period Metzenbachquelle
Flow of wells of the total period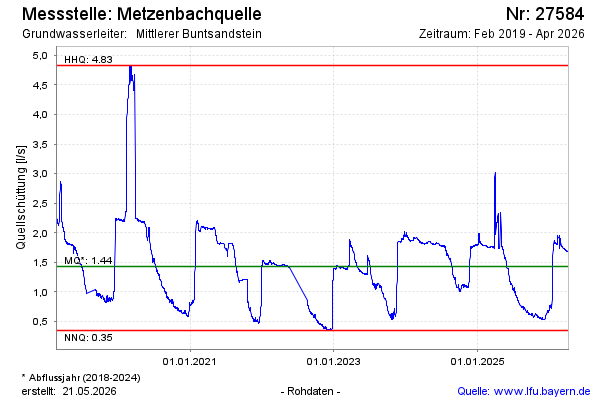
Flow [l/s]: 1,78
Last value from 04.01.2025 10:00
Ground level [m above sealevel]: 457.00
| Date | Flow of well [l/s] |
|---|---|
| 03.01.2025 | 1.80 |
| 02.01.2025 | 1.80 |
| 01.01.2025 | 1.80 |
| 31.12.2024 | 1.81 |
| 30.12.2024 | 1.79 |
| 29.12.2024 | 1.80 |
| 28.12.2024 | 1.81 |
| 27.12.2024 | 1.80 |
© Bayerisches Landesamt für Umwelt 2025