
- Start >
- Groundwater >
- Flow of springs >
- Unterer Main >
- Salzloch 3/2 >
- Chart of total period

Chart of total period Salzloch 3/2
Flow of wells of the total period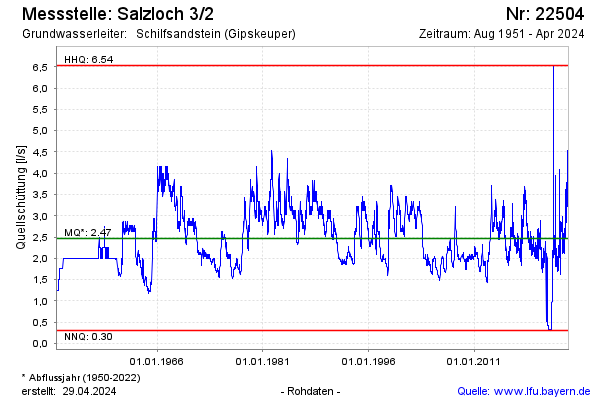
Flow [l/s]: 2,84
Last value from 21.11.2024 10:00
Ground level [m above sealevel]: 327.00
| Date | Flow of well [l/s] |
|---|---|
| 21.11.2024 | 2.85 |
| 20.11.2024 | 2.84 |
| 19.11.2024 | 2.79 |
| 18.11.2024 | 2.66 |
| 17.11.2024 | 2.66 |
| 16.11.2024 | 2.64 |
| 15.11.2024 | 2.59 |
| 14.11.2024 | 2.61 |
© Bayerisches Landesamt für Umwelt 2024