
- Start >
- Groundwater >
- Flow of springs >
- Naab - Regen >
- Bischofsried >
- Current data

Current data Bischofsried
Flow of wells of the last 12 months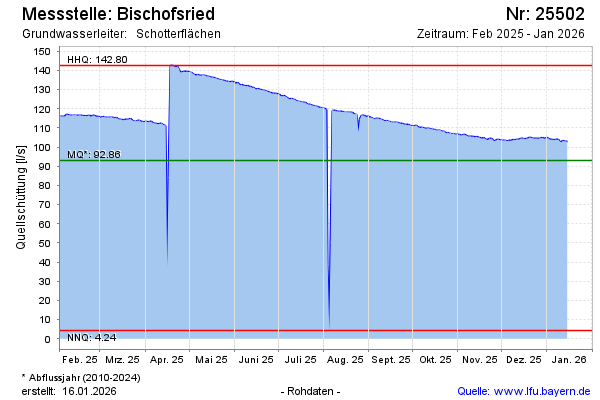
Flow [l/s]: 115,74
Last value from 16.02.2025 07:45
Ground level [m above sealevel]: --
| Date | Flow of well [l/s] |
|---|---|
| 15.02.2025 | 116.66 |
| 14.02.2025 | 116.26 |
| 13.02.2025 | 116.60 |
| 12.02.2025 | 116.71 |
| 11.02.2025 | 116.62 |
| 10.02.2025 | 116.67 |
| 09.02.2025 | 116.43 |
| 08.02.2025 | 116.71 |
© Bayerisches Landesamt für Umwelt 2025