
- Start >
- Groundwater >
- Flow of springs >
- Naab - Regen >
- Bischofsried >
- Chart of total period

Chart of total period Bischofsried
Flow of wells of the total period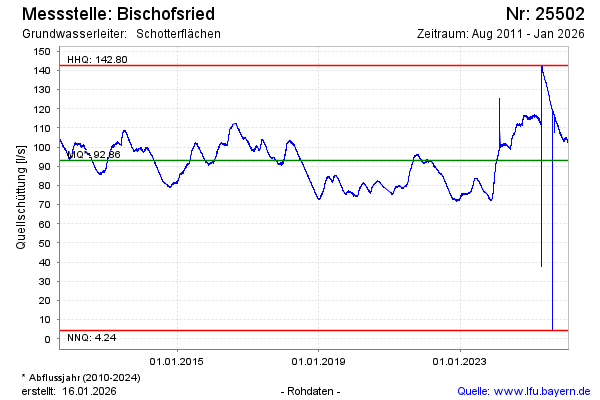
Flow [l/s]: 114,75
Last value from 13.03.2025 07:45
Ground level [m above sealevel]: --
| Date | Flow of well [l/s] |
|---|---|
| 12.03.2025 | 115.27 |
| 11.03.2025 | 115.12 |
| 10.03.2025 | 115.31 |
| 09.03.2025 | 115.64 |
| 08.03.2025 | 115.60 |
| 07.03.2025 | 115.47 |
| 06.03.2025 | 115.61 |
| 05.03.2025 | 115.46 |
© Bayerisches Landesamt für Umwelt 2025