
- Start >
- Groundwater >
- Flow of springs >
- Naab - Regen >
- Blaibach Quelle 1-4 >
- Chart of total period

Chart of total period Blaibach Quelle 1-4
Flow of wells of the total period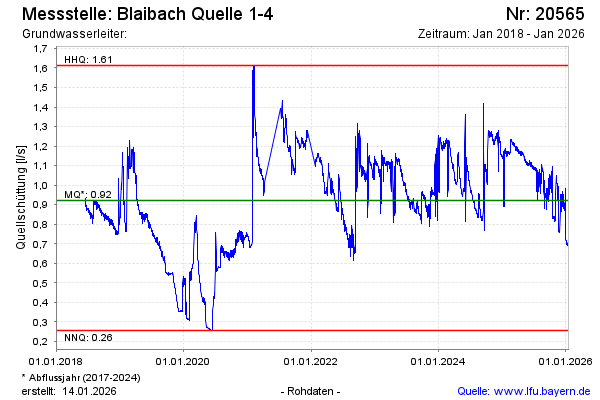
Flow [l/s]: 1,40
Last value from 16.03.2025 10:00
Ground level [m above sealevel]: --
| Date | Flow of well [l/s] |
|---|---|
| 16.03.2025 | 1.39 |
| 15.03.2025 | 1.40 |
| 14.03.2025 | 1.41 |
| 13.03.2025 | 1.41 |
| 12.03.2025 | 1.42 |
| 11.03.2025 | 1.41 |
| 10.03.2025 | 1.42 |
| 09.03.2025 | 1.42 |
© Bayerisches Landesamt für Umwelt 2025