
- Start >
- Groundwater >
- Flow of springs >
- Naab - Regen >
- Hohenwarth 14/2 >
- Chart of total period

Chart of total period Hohenwarth 14/2
Flow of wells of the total period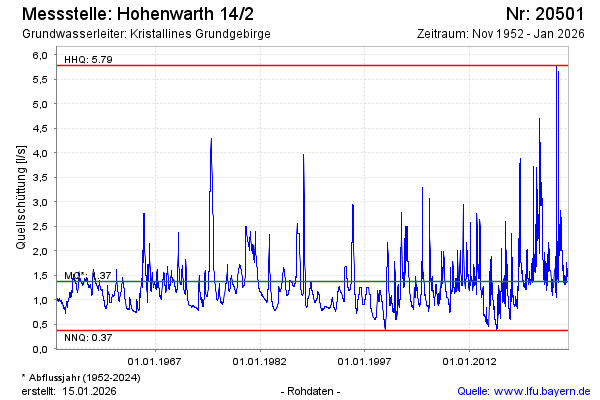
Flow [l/s]: 2,51
Last value from 22.01.2025 10:00
Ground level [m above sealevel]: 565.00
| Date | Flow of well [l/s] |
|---|---|
| 22.01.2025 | 2.48 |
| 21.01.2025 | 2.47 |
| 20.01.2025 | 2.48 |
| 19.01.2025 | 2.50 |
| 18.01.2025 | 2.60 |
| 17.01.2025 | 2.58 |
| 16.01.2025 | 2.55 |
| 15.01.2025 | 2.61 |
© Bayerisches Landesamt für Umwelt 2025