
- Start >
- Groundwater >
- Flow of springs >
- Untere Donau >
- Gori-Quelle >
- Chart of total period

Chart of total period Gori-Quelle
Flow of wells of the total period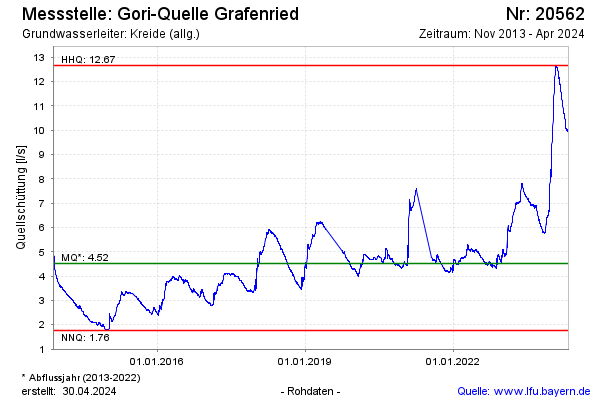
Flow [l/s]: 6,67
Last value from 26.02.2025 10:00
Ground level [m above sealevel]: --
| Date | Flow of well [l/s] |
|---|---|
| 26.02.2025 | 6.65 |
| 25.02.2025 | 6.67 |
| 24.02.2025 | 6.67 |
| 23.02.2025 | 6.67 |
| 22.02.2025 | 6.65 |
| 21.02.2025 | 6.64 |
| 20.02.2025 | 6.60 |
| 19.02.2025 | 6.54 |
© Bayerisches Landesamt für Umwelt 2025