
- Start >
- Groundwater >
- Flow of springs >
- Untere Donau >
- Pleckenstein I-IV >
- Chart of total period

Chart of total period Pleckenstein I-IV
Flow of wells of the total period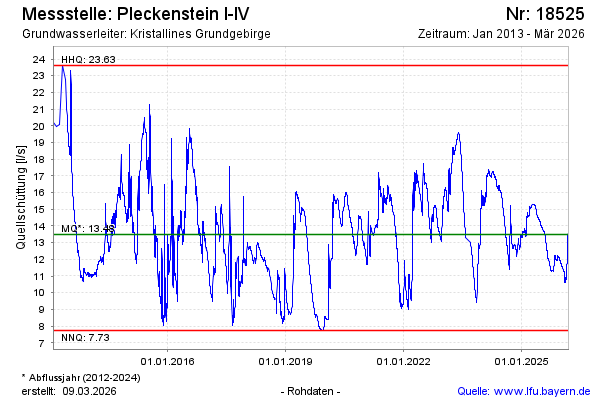
Flow [l/s]: 13,72
Last value from 17.02.2025 01:00
Ground level [m above sealevel]: --
| Date | Flow of well [l/s] |
|---|---|
| 16.02.2025 | 13.46 |
| 15.02.2025 | 13.24 |
| 14.02.2025 | 13.49 |
| 13.02.2025 | 13.56 |
| 12.02.2025 | 13.41 |
| 11.02.2025 | 13.13 |
| 10.02.2025 | 13.11 |
| 09.02.2025 | 13.20 |
© Bayerisches Landesamt für Umwelt 2025