
- Start >
- Groundwater >
- Flow of springs >
- Untere Donau >
- Weissbrunnen >
- Chart of total period

Chart of total period Weissbrunnen
Flow of wells of the total period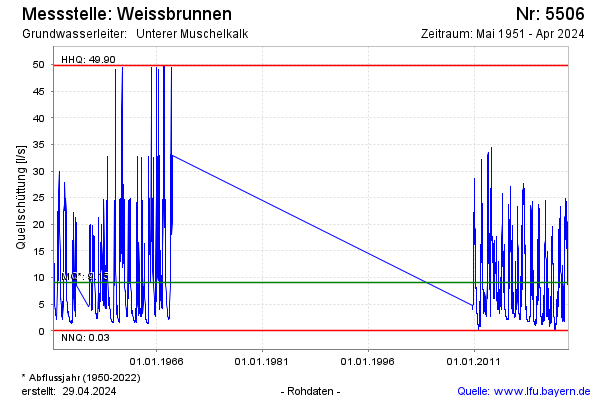
Flow [l/s]: 7,31
Last value from 25.11.2024 10:00
Ground level [m above sealevel]: 339.90
| Date | Flow of well [l/s] |
|---|---|
| 25.11.2024 | 7.34 |
| 24.11.2024 | 7.24 |
| 23.11.2024 | 7.07 |
| 22.11.2024 | 6.98 |
| 21.11.2024 | 6.57 |
| 20.11.2024 | 5.83 |
| 19.11.2024 | 3.49 |
| 18.11.2024 | 3.11 |
© Bayerisches Landesamt für Umwelt 2024