
- Start >
- Groundwater >
- Flow of springs >
- Untere Donau >
- Widderquellen I-III >
- Chart of total period

Chart of total period Widderquellen I-III
Flow of wells of the total period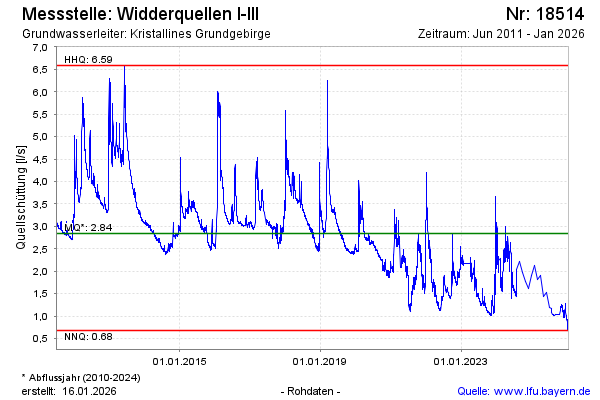
note
Aus techn. Gründen derzeit keine Daten
Flow [l/s]: 3,63
Last value from 03.03.2025 07:25
Ground level [m above sealevel]: 705.00
| Date | Flow of well [l/s] |
|---|---|
| 30.12.2024 | 3.72 |
| 02.12.2024 | 3.44 |
| 30.10.2024 | 3.59 |
| 02.10.2024 | 3.80 |
| 02.09.2024 | 4.05 |
| 01.08.2024 | 3.79 |
| 30.07.2024 | 1.44 |
| 29.07.2024 | 1.43 |
© Bayerisches Landesamt für Umwelt 2025