
- Start >
- Groundwater >
- Flow of springs >
- Regnitz >
- Bischofsried >
- Chart of total period

Chart of total period Bischofsried
Flow of wells of the total period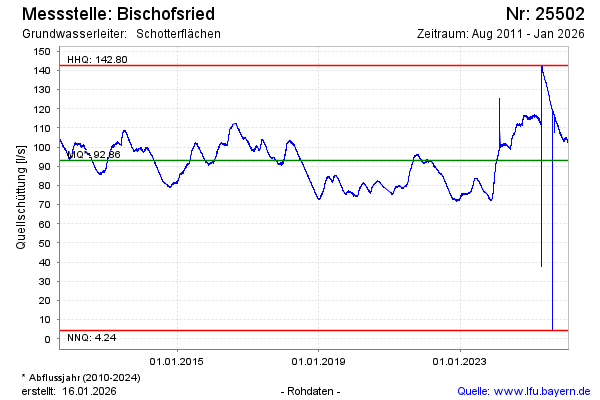
Flow [l/s]: 112,84
Last value from 23.11.2024 07:30
Ground level [m above sealevel]: --
| Date | Flow of well [l/s] |
|---|---|
| 22.11.2024 | 114.63 |
| 21.11.2024 | 115.73 |
| 20.11.2024 | 115.30 |
| 19.11.2024 | 115.93 |
| 18.11.2024 | 115.57 |
| 17.11.2024 | 115.75 |
| 16.11.2024 | 115.85 |
| 15.11.2024 | 115.64 |
© Bayerisches Landesamt für Umwelt 2024