
- Start >
- Groundwater >
- Flow of springs >
- Regnitz >
- VILSQU.,KLEINSCHOENBR. >
- Chart of total period

Chart of total period VILSQU.,KLEINSCHOENBR.
Flow of wells of the total period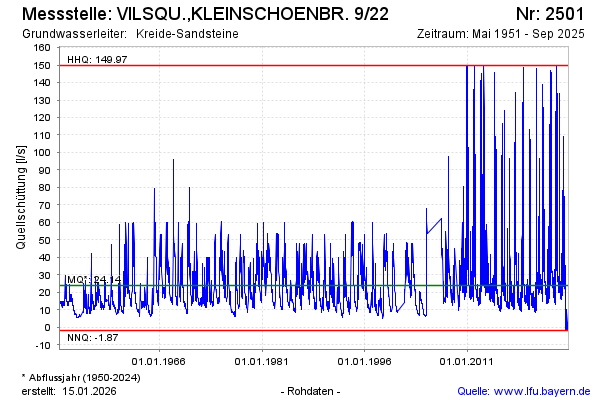
note
Messwerte zeitweise unplausibel
Flow [l/s]: 37,23
Last value from 16.02.2025 09:00
Ground level [m above sealevel]: 455.00
| Date | Flow of well [l/s] |
|---|---|
| 16.02.2025 | 37.63 |
| 15.02.2025 | 39.72 |
| 14.02.2025 | 48.30 |
| 13.02.2025 | 74.81 |
| 12.02.2025 | 29.59 |
| 11.02.2025 | 27.36 |
| 10.02.2025 | 27.95 |
| 09.02.2025 | 28.87 |
© Bayerisches Landesamt für Umwelt 2025