
- Start >
- Groundwater >
- Waterlevel of upper layer >
- Bayern >
- Dinkelsbühl-Waldeck >
- Chart of total period

Chart of total period Dinkelsbühl-Waldeck
Groundwater levels of the total period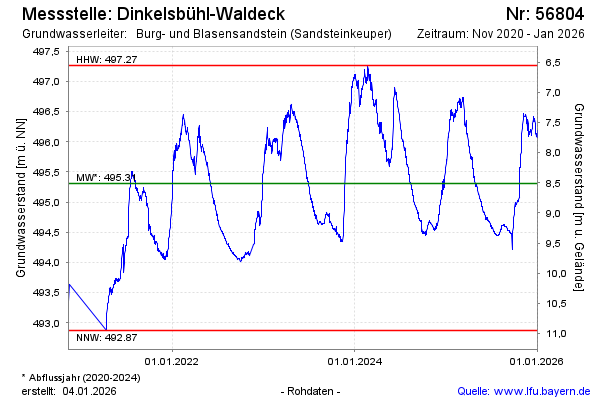
Groundwater level [m above sealevel]: 496.50
Distance to surface [m]: 7.28
Last value from 28.01.2025 12:00
Ground level [m above sealevel]: 503.78
| Date | Groundwater level [m above sealevel] |
|---|---|
| 28.01.2025 | 496.49 |
| 27.01.2025 | 496.48 |
| 26.01.2025 | 496.43 |
| 25.01.2025 | 496.45 |
| 24.01.2025 | 496.44 |
| 23.01.2025 | 496.51 |
| 22.01.2025 | 496.53 |
| 21.01.2025 | 496.50 |
© Bayerisches Landesamt für Umwelt 2025