
- Start >
- Groundwater >
- Waterlevel of upper layer >
- Bayern >
- EGGENFELDEN 10 A >
- Chart of total period

Chart of total period EGGENFELDEN 10 A
Groundwater levels of the total period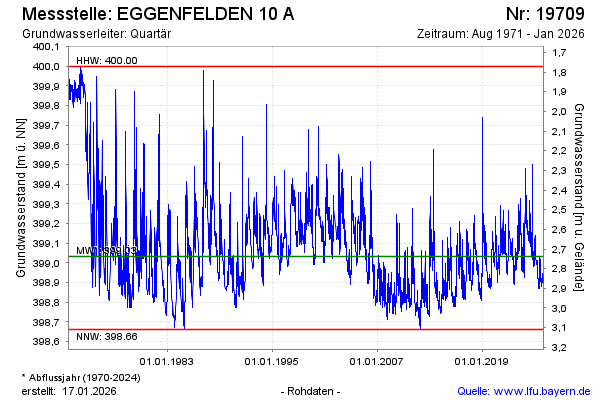
note
GW Messstelle im Grundnetz
Groundwater level [m above sealevel]: 399.02
Distance to surface [m]: 2.75
Last value from 19.02.2025 08:00
Ground level [m above sealevel]: 401.77
Date | Groundwater level [m above sealevel] |
|---|---|
| 19.02.2025 | 399.01 |
| 18.02.2025 | 399.02 |
| 17.02.2025 | 399.02 |
| 16.02.2025 | 399.02 |
| 15.02.2025 | 399.02 |
| 14.02.2025 | 399.02 |
| 13.02.2025 | 399.03 |
| 12.02.2025 | 399.03 |
© Bayerisches Landesamt für Umwelt 2025