
- Start >
- Groundwater >
- Waterlevel of upper layer >
- Bayern >
- Erlangen Q5 >
- Chart of total period

Chart of total period Erlangen Q5
Groundwater levels of the total period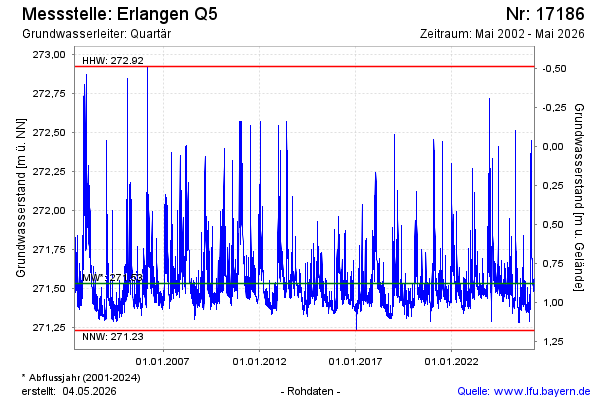
Groundwater level [m above sealevel]: 271.47
Distance to surface [m]: 0.94
Last value from 25.02.2025 10:00
Ground level [m above sealevel]: 272.41
| Date | Groundwater level [m above sealevel] |
|---|---|
| 25.02.2025 | 271.47 |
| 24.02.2025 | 271.48 |
| 23.02.2025 | 271.49 |
| 22.02.2025 | 271.49 |
| 21.02.2025 | 271.49 |
| 20.02.2025 | 271.51 |
| 19.02.2025 | 271.53 |
| 18.02.2025 | 271.55 |
© Bayerisches Landesamt für Umwelt 2025