
- Start >
- Groundwater >
- Waterlevel of upper layer >
- Bayern >
- Kaltenbach - Wallberg Str. 10 >
- Chart of total period

Chart of total period Kaltenbach - Wallberg Str. 10
Groundwater levels of the total period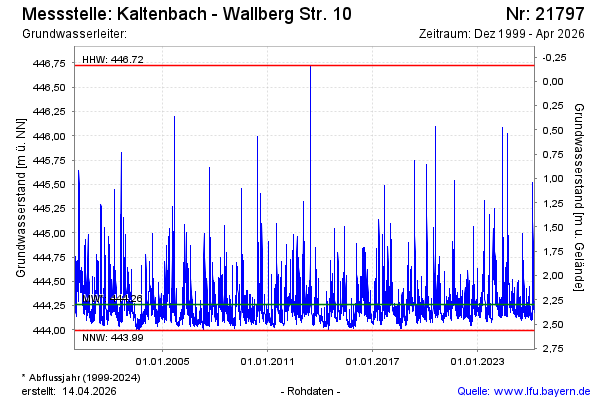
Groundwater level [m above sealevel]: 444.49
Distance to surface [m]: 2.07
Last value from 15.10.2024 10:07
Ground level [m above sealevel]: 446.56
| Date | Groundwater level [m above sealevel] |
|---|---|
| 15.10.2024 | 444.47 |
| 14.10.2024 | 444.47 |
| 13.10.2024 | 444.49 |
| 12.10.2024 | 444.54 |
| 11.10.2024 | 444.64 |
| 10.10.2024 | 444.61 |
| 09.10.2024 | 444.64 |
| 08.10.2024 | 444.57 |
© Bayerisches Landesamt für Umwelt 2024