
- Start >
- Groundwater >
- Waterlevel of upper layer >
- Bayern >
- LESSAU >
- Chart of total period

Chart of total period LESSAU
Groundwater levels of the total period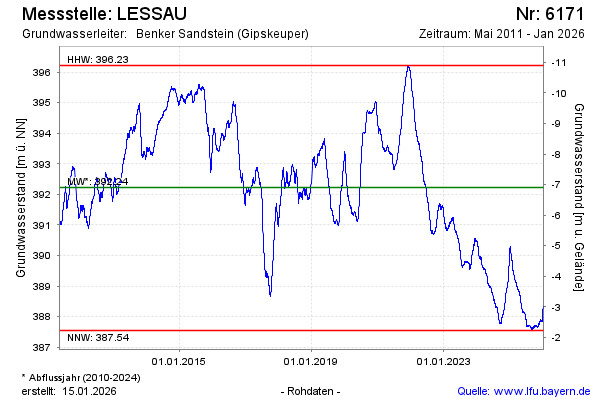
Groundwater level [m above sealevel]: 389.18
Distance to surface [m]: -3.86
Last value from 01.03.2025 09:00
Ground level [m above sealevel]: 385.32
| Date | Groundwater level [m above sealevel] |
|---|---|
| 01.03.2025 | 389.20 |
| 28.02.2025 | 389.21 |
| 27.02.2025 | 389.23 |
| 26.02.2025 | 389.24 |
| 25.02.2025 | 389.24 |
| 24.02.2025 | 389.24 |
| 23.02.2025 | 389.25 |
| 22.02.2025 | 389.27 |
© Bayerisches Landesamt für Umwelt 2025