
- Start >
- Groundwater >
- Waterlevel of upper layer >
- Bayern >
- OBERPOERING B 49 >
- Chart of total period

Chart of total period OBERPOERING B 49
Groundwater levels of the total period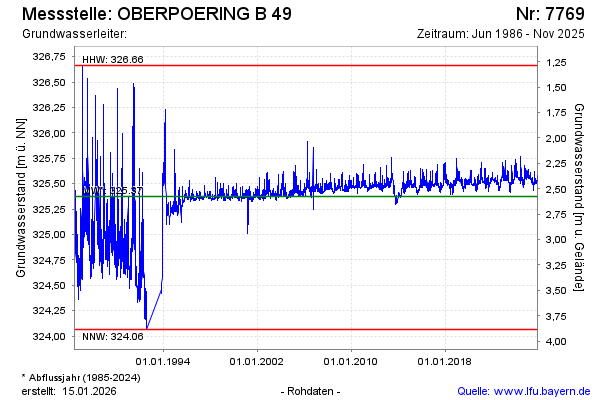
note
GW Messstelle im SN SKS Pielweichs
Groundwater level [m above sealevel]: 325.58
Distance to surface [m]: 2.37
Last value from 14.01.2025 15:40
Ground level [m above sealevel]: 327.95
| Date | Groundwater level [m above sealevel] |
|---|---|
| 31.12.2024 | 325.56 |
| 30.12.2024 | 325.56 |
| 29.12.2024 | 325.56 |
| 28.12.2024 | 325.56 |
| 27.12.2024 | 325.57 |
| 26.12.2024 | 325.57 |
| 25.12.2024 | 325.57 |
| 24.12.2024 | 325.58 |
© Bayerisches Landesamt für Umwelt 2025