
- Start >
- Groundwater >
- Waterlevel of upper layer >
- Bayern >
- SOSSAU G3 >
- Chart of total period

Chart of total period SOSSAU G3
Groundwater levels of the total period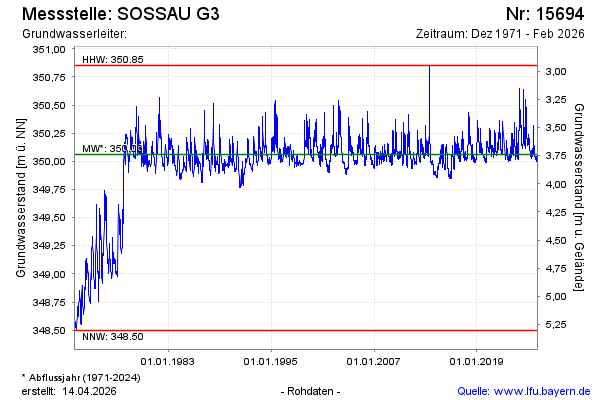
Groundwater level [m above sealevel]: 350.19
Distance to surface [m]: 3.61
Last value from 04.02.2025 13:25
Ground level [m above sealevel]: 353.80
Date | Groundwater level [m above sealevel] |
|---|---|
| 31.12.2024 | 350.16 |
| 30.12.2024 | 350.16 |
| 29.12.2024 | 350.16 |
| 28.12.2024 | 350.16 |
| 27.12.2024 | 350.17 |
| 26.12.2024 | 350.17 |
| 25.12.2024 | 350.17 |
| 24.12.2024 | 350.17 |
© Bayerisches Landesamt für Umwelt 2025