
- Start >
- Groundwater >
- Waterlevel of upper layer >
- Bayern >
- St. Leonhard B10 >
- Chart of total period

Chart of total period St. Leonhard B10
Groundwater levels of the total period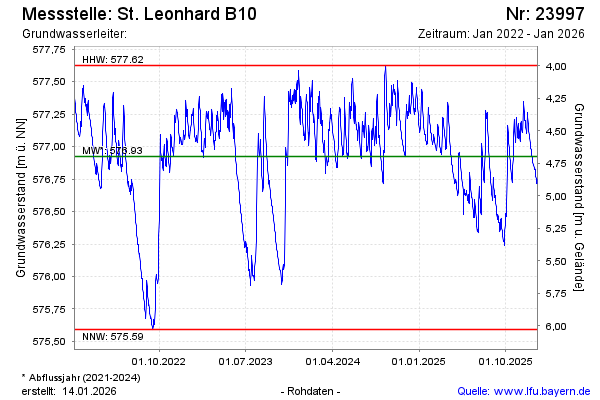
Groundwater level [m above sealevel]: 577.01
Distance to surface [m]: 4.61
Last value from 20.02.2025 09:00
Ground level [m above sealevel]: 581.62
| Date | Groundwater level [m above sealevel] |
|---|---|
| 23.02.2025 | 576.98 |
| 22.02.2025 | 577.00 |
| 21.02.2025 | 577.00 |
| 20.02.2025 | 577.01 |
| 19.02.2025 | 577.03 |
| 18.02.2025 | 577.05 |
| 17.02.2025 | 577.07 |
| 16.02.2025 | 577.09 |
© Bayerisches Landesamt für Umwelt 2025